A year ago, about one in four commercial Google searches opened with an AI Overview. Today it is one in two. That is the headline number in DataForSEO’s new Search Insider 2026 report, and it changes how agencies and in-house teams should plan search work for the year ahead.
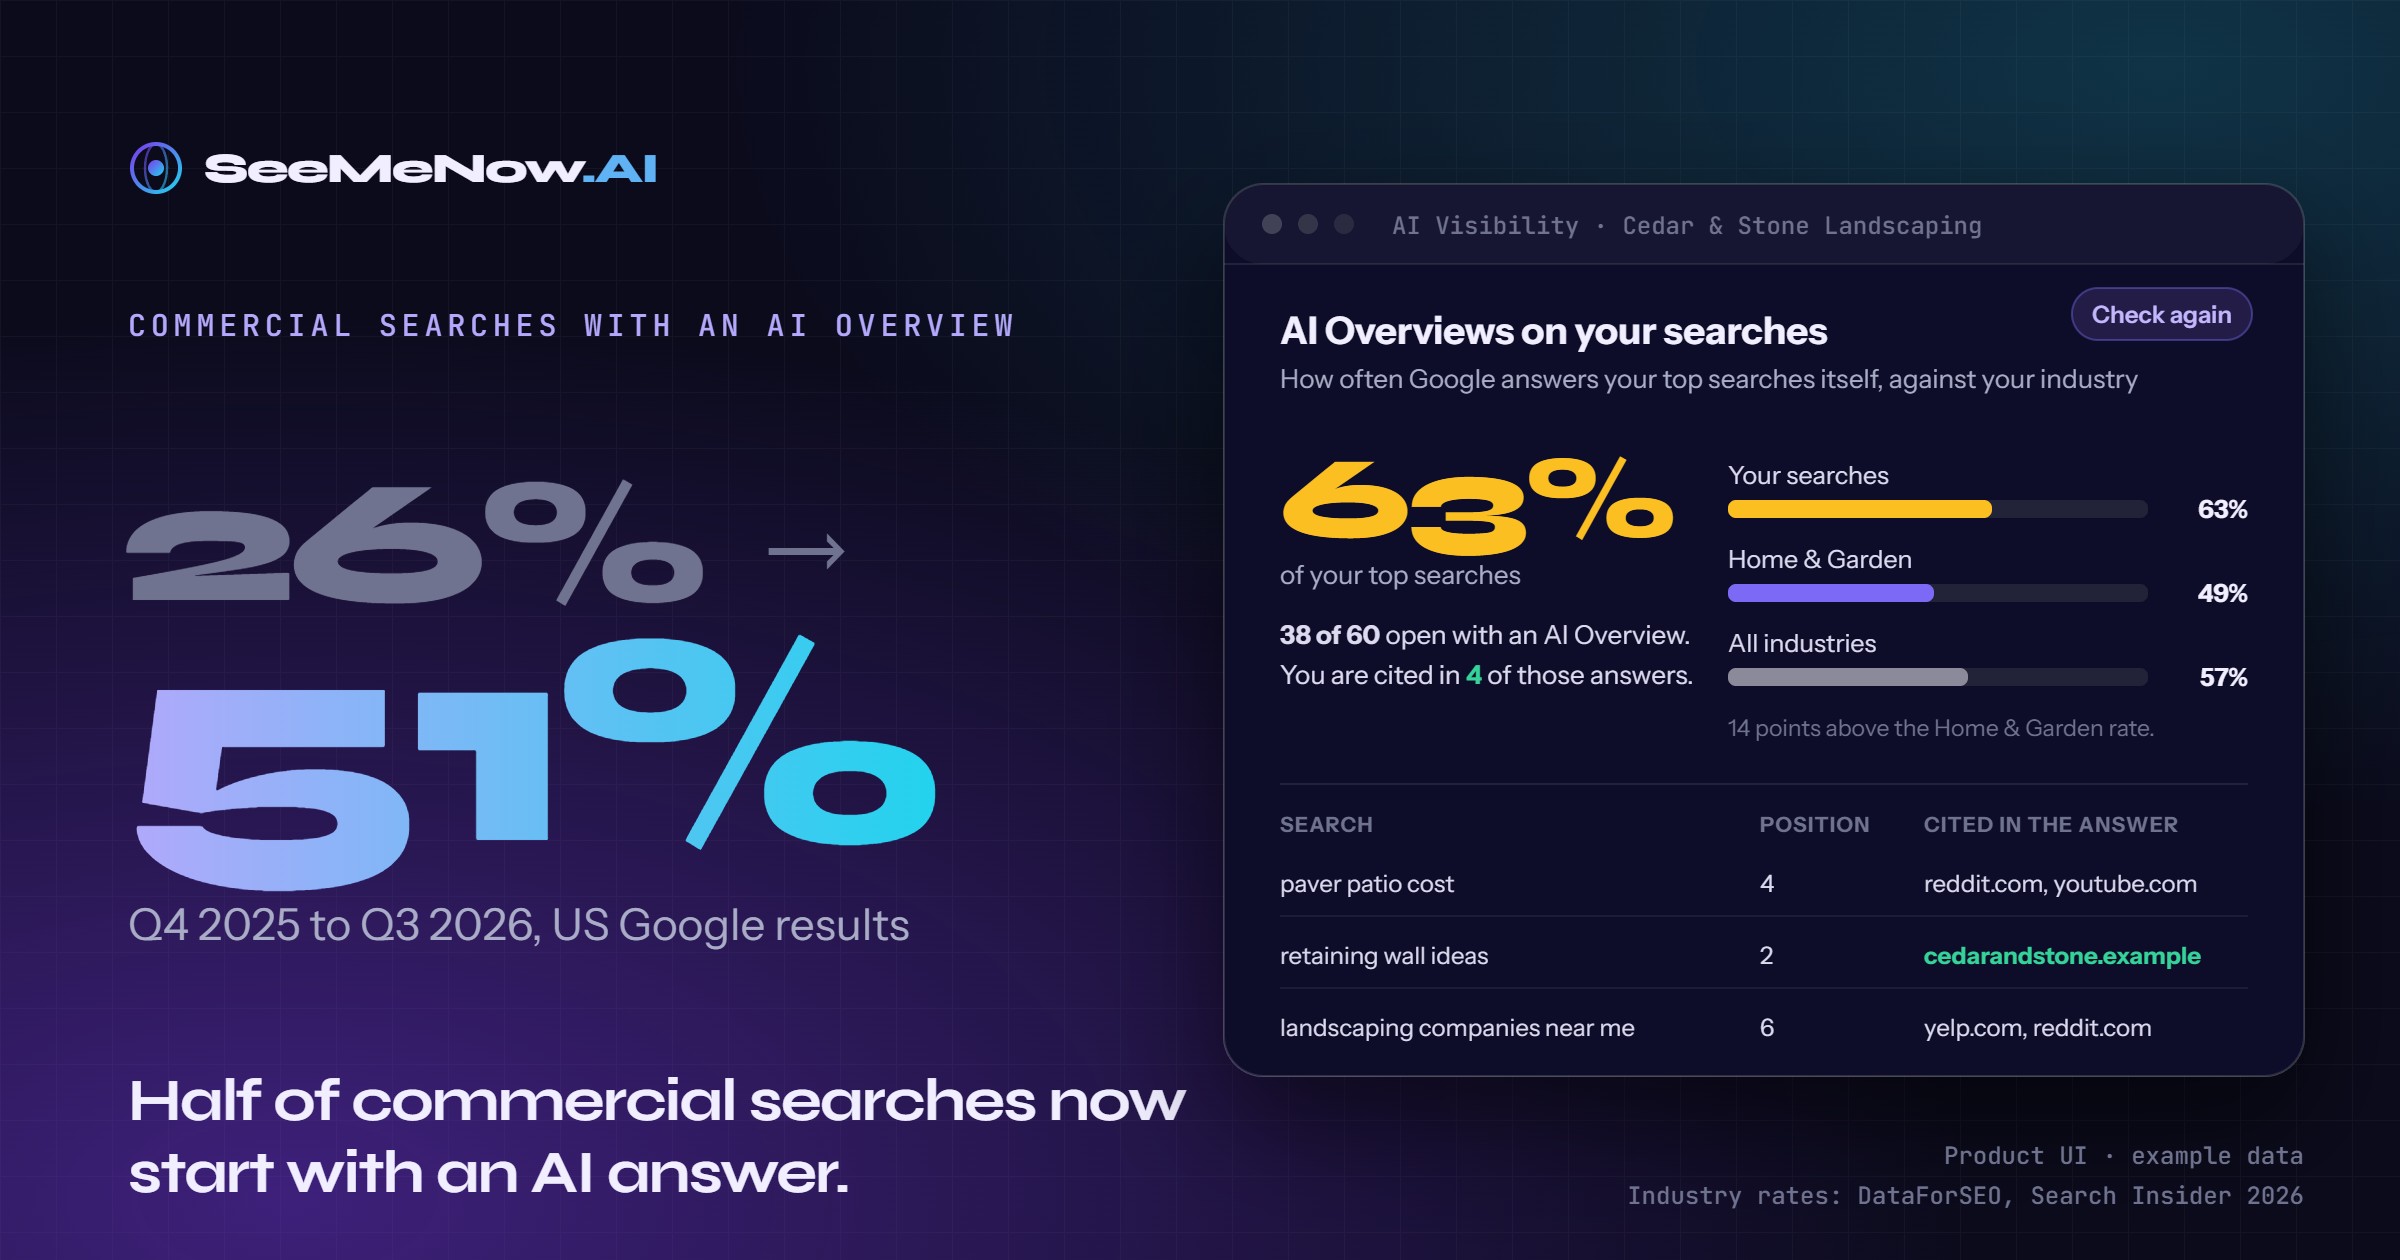
Commercial searches are where buyers compare their options: “best payroll software for small business,” “commercial landscaping companies near me,” “top-rated CRM for agencies.” Between the last quarter of 2025 and the third quarter of 2026, the share of those searches that trigger an AI Overview went from 26% to 51%. Informational searches went from 48% to 70%, and even transactional searches, where someone is ready to buy, went from 11% to 29%.
Below is what the report found about clicks, exposure by industry and where AI answers get their sources, and what to do about each. The figures draw on 190 million keywords and 165 million AI answers, all US and English.
What an AI answer does to a #1 ranking
Ranking first on Google still matters. It is worth less than it was when an AI Overview sits above it, and that changes the conversation with every client or stakeholder who measures success by position.
The report models where clicks go on results pages with and without an AI Overview. Without one, the top organic result takes an estimated 33 to 38% of clicks, depending on the search intent. With one, it takes 21 to 24%. The AI Overview’s own citations take 42 to 45%, and positions two through ten lose roughly a third to two fifths of their combined share.
Put plainly: on a commercial search with an AI answer, the #1 result loses nearly four of every ten clicks it used to get. On informational searches it is more than four in ten. The report calls these modeled estimates from clickstream data rather than observed clicks, and so do we. The direction is not in doubt.
The click-through rates tell the same story from the other side. Across more than 2,000 sites, desktop click-through for the #1 organic position fell from 17.8% in September 2025 to 7.4% in August 2026, and position two fell from 15.3% to 3.1%. Mobile held up better, with the #1 position going from 25.2% to 20.8%.
The report does not say how much of that drop AI answers caused, but it is the pattern behind one of the most common reporting conversations of 2026: rankings held, traffic fell.
How fast this happened
AI Overviews appeared on 5.9% of US Google results in September 2024. By August 2026 it was 61.4%. That is a tenfold increase in two years, and the curve is still rising.
Some of the features marketers spent years optimizing for have all but gone. Featured snippets fell from 9% of results to 0.4%, and discussions and forums fell from 21% to 7%.
Two things held or grew: video results doubled to 20%, and the local pack rose from 20% to 26%. For brands and clients with a local presence, the map pack still matters as much as it ever did.
The long tail is not a hiding place
A common reaction is to retreat to smaller, easier keywords where the AI is less likely to be. The data says that does not work.
Keywords with 201 to 300 searches a month trigger an AI Overview 59% of the time, more often than keywords with 601 or more (49%). Mid-difficulty keywords trigger one about 65% of the time, more often than the hardest ones (54%). Expensive keywords are not protected either: searches that cost advertisers $5 or more a click trigger an AI Overview 50% of the time, almost the same as searches that cost a quarter or less (51%).
Low volume, low difficulty and low cost do not mean low AI exposure. What does move the rate is the kind of search and the industry behind it.
Which industries feel it most
The report breaks AI Overview presence down by industry. The overall rate is 57% of results. The spread around it is wide.
| Industry | Results with an AI Overview |
|---|---|
| Health | 70% |
| Finance | 69% |
| Law & Government | 61% |
| Business & Industrial (agencies, B2B services) | 58% |
| Home & Garden (lawn care, landscaping, plumbing, HVAC) | 49% |
| Travel & Tourism | 47% |
| Retail & General Merchandise | 43% |
| Dining & Nightlife | 29% |
| Real Estate | 22% |
For an agency, this is the spread across a client list. A health or finance client sees an AI Overview on about seven in ten results, and a home services client on about one in two. A restaurant or real estate client sees far fewer today, but across all searches the rate is still climbing.
The same ranking can face very different levels of AI competition depending on what the business does. That is why an industry average is a starting point and not an answer: every brand, and every client, needs its own number from its own top searches.
SeeMeNow.AI works that number out for every project. The AI Visibility page checks the project’s top non-brand searches from Search Console, shows how many open with an AI Overview, and puts that industry’s rate from this report beside it. An agency sees it for each client, and an in-house team sees it for its own brand, without anyone checking results pages by hand.
Where the AI gets its answers
The second half of the report answers the question clients and leadership now ask most often: who does the AI cite instead of us?
For Google AI Overviews, the most cited domains are YouTube, Reddit, Facebook, Wikipedia, Google itself, Instagram and Quora. Six of the top ten are video, social or community platforms. Yelp is fifteenth and Tripadvisor is twenty-first. Reddit alone appears in the top ten organic results for 32% of searches, nearly eight times Quora.
ChatGPT leans toward reference sites: Wikipedia and Reddit lead its citations, followed by Fandom, Britannica and NIH, and news publishers such as Reuters and AP News make its top thirty. YouTube is nineteenth there, and Facebook, Instagram and TikTok are not in its top thirty. And 27% of ChatGPT answers cite no source at all, against under 1% of AI Overviews.
Two things follow. First, the competition for an AI citation is not only other brands’ websites. A YouTube video, a Reddit thread or a review profile can be the source the AI quotes, so those channels are now part of search work, not side projects. Second, Google’s AI and ChatGPT draw on different sources, so showing up in one does not mean showing up in the other. Track them separately.
This is the gap SeeMeNow.AI’s Conversations module was built for. It finds the Reddit, Quora, YouTube, Facebook, LinkedIn and forum threads that turn up as citations in its AI scans, or that rank in Google’s top ten for the keywords you track. It flags the threads under questions where the brand is absent, which are the strongest leads, because the conversation is happening, it is being cited or ranking, and the brand is not in it. You can keep track of the threads you have responded to, and an agency can send a thread straight to the client who should join it.
The AI scans handle the second point. Every two weeks, SeeMeNow.AI asks ChatGPT and Gemini the questions a brand’s buyers ask, and it tracks mentions and citations in Google AI Overviews as well. You can see which questions name the brand, which name a competitor instead, and where the brand is cited in AI Overviews.
Backlinks still count, including for AI citations
The report also looked at whether the old signals still matter. They do. Sites ranking #1 have a median of 111 referring domains, against 85 for positions four through ten. Sites cited in AI Overviews for competitive keywords have substantially more referring domains than sites cited for easy ones.
The relationship between referring domains and AI citations is a moderate correlation, and the report says so plainly: association, not cause. But it means the work that earned search visibility is not wasted in the AI era. It is one of the few things the two surfaces have in common.
What to do with this
The report ends with five priorities. Here they are, in the order a busy agency or in-house team should take them.
1. Find out your own exposure. Industry averages tell you the weather. You need to know how many of each brand’s own searches open with an AI answer, and whether the brand is cited in it. Pull the top searches from Search Console, check the result page for each, and count, or let the AI Visibility page in SeeMeNow.AI do it for every project.
2. Treat the AI answer as a competitor with a source list. When an AI Overview sits on a search you care about, look at who it cites. Sometimes it is a competitor’s page. Often it is a YouTube video, a Reddit thread or a review site, and each of those is a place the brand can be. In SeeMeNow.AI, every question where a competitor is named instead of the brand becomes a gap you can turn into a brief, and the threads behind it show up in Conversations.
3. Keep the fundamentals. The local pack grew. Referring domains still correlate with both rankings and citations. Video doubled. None of this replaces the work; it changes what the work is for.
4. Publish what only the business knows. AI Overviews cite a source for almost every answer, and that source has to come from somewhere. A page that carries first-hand answers from the people who do the work is a page the AI can cite and a competitor cannot copy.
This is what the Expertise module in SeeMeNow.AI does. It asks the people who do the work a few plain questions in a Google Doc, in their own subject, and they answer in a minute or two. Their answers go into the content credited to them, and nothing is invented: every claim on the page traces back to something a person wrote.
For an agency, that means content no other agency can write for that client. For an in-house team, it turns the knowledge inside the business into the thing competitors cannot copy.
5. Measure more than rankings. Where a brand ranks, where it is cited and where it is mentioned are three different views of whether a customer can find it. A rank tracker shows one of them. SeeMeNow.AI keeps Search Console rankings, AI mentions and citations, and the conversations around a brand in one place, so the client report or leadership update can show all three.
Where SeeMeNow.AI fits
SeeMeNow.AI is a decision engine for search and AI visibility. It reads a site’s Search Console and GA4 data alongside the AI scans, Conversations and Expertise answers above, and decides the three or four moves that will get the brand seen more in Google and in AI answers. Then it drafts the work and measures what each change achieved.
Every Monday, each project gets those moves, ranked, with the numbers and the reason. Nothing changes on the site until someone approves it, and every finished change gets a verdict at 30, 60 and 90 days against the whole site, so a good season is not mistaken for good work.
For agencies, the weekly and monthly reports go out white-label, with your logo, colors, footer and sender name and no “powered by” line, so AI visibility becomes a service you sell under your own brand. For in-house teams, it is a plan sized for a small team and a measured answer when leadership asks whether the work paid off.
Start a 14-day free trial on one project, whether that is a client or your own brand. Every feature is included, and no card is required.
Frequently asked questions
How often do AI Overviews appear in Google search?
On 61.4% of US Google results in August 2026, up from 5.9% in September 2024, according to DataForSEO’s Search Insider 2026 report. On commercial searches, the share went from 26% in the last quarter of 2025 to 51% in the third quarter of 2026.
How many clicks does an AI Overview take from the #1 result?
DataForSEO estimates that the top organic result’s share of clicks falls from 33 to 38% to 21 to 24% when an AI Overview appears, while the AI Overview’s citations take 42 to 45%. These are modeled estimates from clickstream data, not observed clicks.
Which industries see the most AI Overviews?
Health (70% of results) and Finance (69%) see the most. Real Estate (22%) and Dining & Nightlife (29%) see the fewest. The rate across all industries is 57%.
Which websites do AI Overviews cite most often?
YouTube, Reddit, Facebook, Wikipedia and Google lead Google AI Overview citations. ChatGPT leans toward reference sites, with Wikipedia and Reddit at the top.
How can I see how many of my own searches show an AI Overview?
Pull your top non-brand searches from Search Console and check the results page for each. SeeMeNow.AI does this for every project on its AI Visibility page and shows your industry’s rate beside it.
Sources
All statistics in this post are from DataForSEO, Search Insider: 2026 Edition (October 2026), US and English-language data: AI Overview trigger rates by intent (Table B1), by search volume (B2), by keyword difficulty (B3), by cost per click (B4) and by industry (B5); SERP feature presence September 2024 to August 2026 (Table A4); organic click-through rates (Table A2); estimated click share with and without AI Overviews (Table A3); most-cited domains (Table C3); Reddit presence (Table D1); referring domains by position (Table D4).